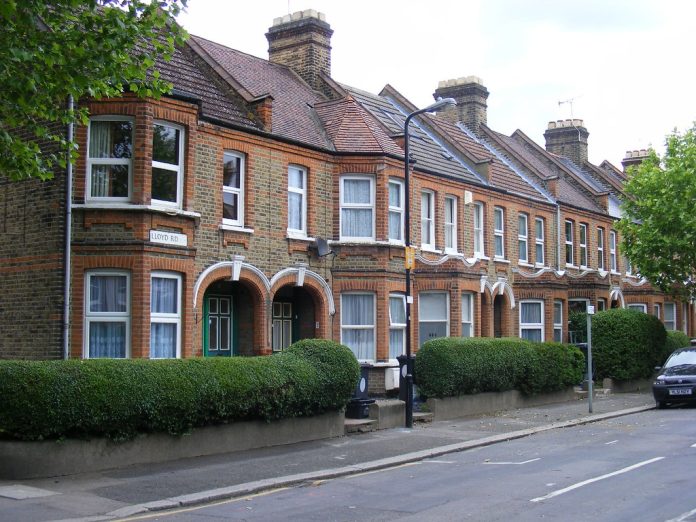
- Waltham Forest in London has seen the biggest return on investment in property in the UK, with a 113.6% increase in property price over the last decade.
- Thanet in Kent has the second best return on investment with house prices having risen 111.9% since 2012.
- The City of Aberdeen has seen the worst return on investment in the UK for property, being the only area to see a decrease in property prices over the past ten years.
New research shows the UK areas with the highest increase in property prices in the past decade with Waltham Forest in London taking the top spot, with a house price increase of 113.6% over the last ten years.
The study conducted by online trading platform, CMC Markets, analysed house price data from the Office for National Statistics (ONS) for each local authority in the UK between 2012 and 2022 to discover which area saw the highest increase in house prices and therefore provides the highest return on investment.
| The 10 UK areas with the biggest increase in house prices | ||||
| Rank | Area | Average house price in 2012 | Average house price in 2022 | Percentage increase |
| 1 | Waltham Forest | £226,741.68 | £484,229.52 | 113.6% |
| 2 | Thanet | £142,273.02 | £301,510.06 | 111.9% |
| 3 | Barking and Dagenham | £165,049.09 | £340,135.34 | 105.9% |
| 4 | Hastings | £137,735.62 | £271,106.08 | 96.8% |
| 5 | Hackney | £315,619.92 | £620,147.39 | 96.5% |
| 6 | Medway | £147,594.92 | £288,804.93 | 95.7% |
| 7 | Dover | £157,717.70 | £307,570.02 | 95.0% |
| 8 | Bexley | £199,584.95 | £389,033.89 | 94.9% |
| 9 | Bristol, City of | £174,024.30 | £338,773.82 | 94.7% |
| 10 | Thurrock | £199,584.95 | £314,816.77 | 94.4% |
The analysis revealed that Waltham Forest in London has the biggest return on investment for property in the UK, with a 113.6% increase in house prices since
2012. Currently, the average house price in Waltham Forest is £484,229.52 whereas a decade ago, the average cost was £226,741.68.
The area with the second highest increase in property prices is Thanet in Kent. House prices in Thanet averaged at £142,273.02 in 2012 and have risen to £301,510.06 as of this year. This means that there has been a 111.9% rise in prices.
Barking and Dagenham is the area with the third highest rise in property in the UK, therefore having the third best return on investment. There has been a 105.9% rise in house prices in the London borough in the past decade. In 2012, the average house price in Barking and Dagenham was £165,049.09 whereas in 2022, the average house price now stands at £340,135.34 according to the ONS data.
Hastings in East Sussex places fourth. House prices in Hastings have skyrocketed 96.8% since 2012, when house prices were at an average of £137,735.62 compared to today’s average price of £271,106.08.
Another London borough rounds out the top five with Hackney seeing a 96.5% rise in house prices. House prices in Hackney have risen from £315,619.92 to £620,147.39 in the past ten years, leading to its status as the area with the fifth highest return on investment in property.
| The 10 UK areas with the lowest increases in house prices | ||||
| Rank | Area | Average house price in 2012 | Average house price in 2022 | Percentage increase |
| 1 | Aberdeen, City of | £160,525.51 | £144,614.52 | -9.9% |
| 2 | Inverclyde | £100,389.36 | £115,244.09 | 14.8% |
| 3 | Aberdeenshire | £173,885.79 | £200,590.18 | 15.4% |
| 4 | County Durham | £98,549.76 | £123,308.60 | 25.1% |
| 5 | Middlesbrough | £108,284.80 | £136,076.61 | 25.7% |
| 6 | Allerdale | £138,587.99 | £176,014.94 | 27.0% |
| 7 | Stockton-on-Tees | £120,795.27 | £154,304.44 | 27.7% |
| 8 | Angus | £128,501.03 | £164,658.57 | 28.1% |
| 9 | Carlisle | £121,571.35 | £156,869.71 | 29.0% |
| 10 | Preston | £117,591.05 | £153,254.17 | 30.3% |
At the other end of the scale, the City of Aberdeen is the UK area that has seen the lowest return on investment in property, being the only area where house prices have actually decreased. In 2012, the average house price in the City of Aberdeen was £160,525.51 but the average price has now decreased by 9.9% in the past ten years, with the average price costing £144,614.52 in 2022.
The UK area with the second lowest increase in house prices is Inverclyde. House prices in Inverclyde averaged at £100,389.36 in 2012 and have risen to £115,244.09 as of this year. This means that there has been a 14.8% rise in prices – the second lowest number of any local authority analysed.
Aberdeenshire (the surrounding area of the city) has the third lowest increase in property prices in the last decade. There has been a 15.4% rise in house prices in the Scottish area in the past decade. In 2012, the average house price in Aberdeenshire was £173,885.79 whereas in 2022, the average house price now stands at £200,590.18 according to the ONS data.
County Durham places fourth. House prices in County Durham have only risen by 25.1% since 2012, when house prices were at an average of £98,549.76 compared to today’s average price of £123,308.60.
Middlesbrough rounds out the bottom five with Middlesbrough seeing a 25.7% rise in house prices. House prices in Middlesbrough have risen from £108,284.80 to £136,076.61 in the past ten years, leading to its status as the area with the fifth lowest return on investment in property.
The study was conducted by CMC Markets, a UK-based financial services provider offering online leveraged trading in the form of spread betting and contracts for difference across global markets. Click here to learn more.

